Download the Lessonotes Mobile Liberia app for faster lesson access on Android and iPhone.
Subject: Economics
Semester: 2
Period: 5
Week: 27
School Name:
Teacher’s Name:
Subject: Economics
Grade Level: Grade 10
Week & Period: Week 27, Period V
Date:
Topic: Basic Tools of Economic Analysis
Sub-topic: Measures of Central Tendency – Arithmetic Mean
Learning Objectives:
By the end of the lesson, learners should be able to:
- Define arithmetic mean (average).
- Distinguish between raw and grouped data.
- Calculate the mean of a given set of data.
- Interpret economic meaning of calculated averages.
Instructional Materials:
- Graph sheets
- Rulers and pencils
- Scientific calculator
- Sample data (e.g., income, prices, test scores)
- Charts illustrating formulae
- Board and markers
Anticipatory Set (Warm-Up):
Ask: “If three students earn $5, $10, and $15 each—what is the average income? Why might this be useful in economics?”
Encourage learners to share their approach to calculating the average.
Building Background Knowledge (Main Lesson):
Definition of Mean:
- Arithmetic mean is the sum of all values divided by the number of values.
- It is commonly used in economics to represent average income, average consumption, etc.
Formula (Ungrouped Data):
![]()
Where:
- ∑x = Sum of values
- n = Number of values
Example 1 (Ungrouped Data):
Find the mean of 8, 10, 12, 14.
![]()
Grouped Data Mean Formula (Using Midpoints):
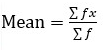
Where:
- f = frequency
- x = midpoint of each class
- fx = product of frequency and midpoint
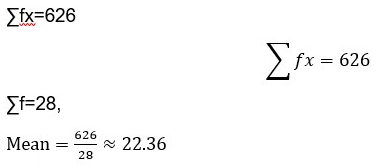
Example 2 (Grouped Data):
|
Class Interval |
Frequency (f) |
Midpoint (x) |
fx |
|
0 – 9 |
4 |
4.5 |
18 |
|
10 – 19 |
6 |
14.5 |
87 |
|
20 – 29 |
10 |
24.5 |
245 |
|
30 – 39 |
8 |
34.5 |
276 |
Solution:
Real-Life Application in Economics:
- Average income of households
- Mean price of commodities
- Useful in policy decisions and economic planning
Class Activities:
- Calculate the mean for both ungrouped and grouped data.
- Analyze what the calculated mean tells us about the population or economic variable.
Assessment:
Answer the following:
- Define arithmetic mean.
- Find the mean of 12, 14, 16, 18, 20.
- Complete the table and find the mean:
|
Class Interval |
Frequency |
|
5 – 14 |
3 |
|
15 – 24 |
5 |
|
25 – 34 |
7 |
|
35 – 44 |
5 |
Homework:
- Calculate the mean from the table below:
|
Wages ($) |
Frequency |
|
10 – 20 |
4 |
|
21 – 30 |
6 |
|
31 – 40 |
10 |
Expanded Notes:
- Mean is sensitive to outliers.
- Not ideal for skewed data but useful for normally distributed sets.
- Grouped data mean requires midpoint estimation.
Differentiation:
- Use visual aids for struggling learners.
- Assign advanced learners a task using real market data.
- Group discussions to interpret results meaningfully.
Teacher’s Reflection:
- Were learners able to apply the formula correctly?
- Did they understand how to interpret the average economically?
- Were both grouped and ungrouped data understood well?