Download the Lessonotes Mobile Liberia app for faster lesson access on Android and iPhone.
Subject: Economics
Semester: 2
Period: 5
Week: 28
School Name:
Teacher’s Name:
Subject: Economics
Grade Level: Grade 10
Week & Period: Week 28, Period V
Date:
Topic: Basic Tools of Economic Analysis
Sub-topic: Measures of Central Tendency – Median
Learning Objectives:
By the end of this lesson, learners should be able to:
- Define median and describe its use in economics.
- Distinguish between median in ungrouped and grouped data.
- Calculate the median from raw data and frequency distribution tables.
- Interpret and apply median in analyzing economic data sets.
Instructional Materials:
- Chart papers with data samples
- Rulers and pencils
- Scientific calculator
- Sample data on household incomes
- Graphs and illustrations
- Board and marker
Anticipatory Set (Warm-Up):
Ask learners: “What does the middle person earn if ten people’s monthly salaries are arranged from lowest to highest?”
Introduce the idea of median as the middle value of a data set.
Building Background Knowledge (Main Lesson):
Definition of Median:
The median is the middle value when data is arranged in ascending or descending order.
- For odd number of items: middle value.
- For even number: average of the two middle values.
Ungrouped Data Example:
Find the median of 8, 10, 12, 14, 16
- Arranged: 8, 10, 12, 14, 16
- Median = 12 (3rd value)
If data is: 8, 10, 12, 14
- Median = (10 + 12) / 2 = 11
Grouped Data Median Formula:
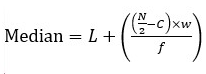
Where:
- L = lower boundary of median class
- N = total frequency
- C = cumulative frequency before median class
- f = frequency of median class
- w = width of class interval
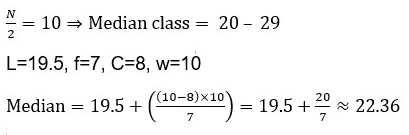
Example:
|
Class Interval |
Frequency (f) |
Cumulative Frequency |
|
0 – 9 |
2 |
2 |
|
10 – 19 |
6 |
8 |
|
20 – 29 |
7 |
15 |
|
30 – 39 |
5 |
20 |
Total frequency N=20
Real-Life Application in Economics:
- Median income or wage is often a better indicator of income distribution than the mean, especially where outliers exist.
Class Activities:
- Learners to compute median from raw and grouped data sets.
- Group activity to compare the economic implications of mean vs median.
Assessment Questions:
- Define median and explain when it is preferred over mean.
- Calculate the median of: 6, 8, 12, 15, 18
- Use the following to compute the median:
|
Class Interval |
Frequency |
|
5 – 14 |
3 |
|
15 – 24 |
5 |
|
25 – 34 |
7 |
|
35 – 44 |
5 |
Homework:
- Find the median for this dataset: 4, 6, 9, 11, 14, 18, 20
- Calculate the median from the grouped data below:
|
Income ($) |
Frequency |
|
100–199 |
5 |
|
200–299 |
10 |
|
300–399 |
6 |
|
400–499 |
9 |
Expanded Notes:
- Median is not affected by extreme values (unlike mean).
- Median gives a better sense of middle income or price in economic analysis.
- It is often used in wage analysis and poverty studies.
Differentiation:
- Provide a step-by-step worksheet with formulas.
- Use diagrams to show position of median in datasets.
- Advanced students can solve using larger data groups or real-life examples.
Teacher’s Reflection:
- Were students able to apply the formula for grouped median?
- Did they grasp the concept of data centrality?
- Did learners see practical relevance in economic analysis?