Download the Lessonotes Mobile Liberia app for faster lesson access on Android and iPhone.
Subject: Economics
Semester: 2
Period: 5
Week: 29
School Name:
Teacher’s Name:
Subject: Economics
Grade Level: Grade 10
Week & Period: Week 29, Period V
Date:
Topic: Basic Tools of Economic Analysis
Sub-topic: Measures of Central Tendency – Mode
Learning Objectives:
By the end of this lesson, learners should be able to:
- Define mode and explain its significance in Economics.
- Distinguish between modal class and mode in grouped and ungrouped data.
- Calculate mode from both raw data and frequency distribution tables.
- Apply the concept of mode to real-life economic scenarios.
Instructional Materials:
- Chart paper with datasets
- Pictorial illustrations (e.g. histogram)
- Frequency distribution tables
- Calculator
- Sample income data
- Rulers and graph boards
Anticipatory Set (Warm-Up):
Ask learners: “Which shoe size is most common in our class?”
Guide them to discover the idea of mode as the most frequent value in a dataset.
Building Background Knowledge (Main Lesson):
Definition of Mode:
- The mode is the value that appears most frequently in a dataset.
- A dataset may have:
- One mode (unimodal)
- Two modes (bimodal)
- More than two modes (multimodal)
Ungrouped Data Example:
Find the mode in: 4, 5, 6, 5, 8, 9, 5, 10
- Mode = 5 (appears 3 times, more than others)
Grouped Data Mode Formula:
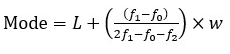
Where:
- L = lower boundary of modal class
- = frequency of modal class
- = frequency before modal class
- = frequency after modal class
- w = class width
Example:
|
Class Interval |
Frequency |
|
10–19 |
5 |
|
20–29 |
12 ← modal class |
|
30–39 |
9 |
|
40–49 |
4 |
L=19.5, f1=12, f0=5, f2=9, w=10
![]()
Application in Economics:
- Mode helps in identifying the most common income, price, or demand level.
- Especially useful in market analysis and product pricing.
Class Activities:
- Identify the mode in ungrouped class test scores.
- Solve grouped mode problems using the formula.
- Discuss the implication of modal salary in a factory.
Assessment Questions:
- Define mode and list types of datasets it applies to.
- What is the mode of: 12, 13, 15, 13, 16, 13, 18, 14?
- Use the data below to compute mode:
|
Class Interval |
Frequency |
|
0 – 9 |
3 |
|
10 – 19 |
7 |
|
20 – 29 |
10 ← modal class |
|
30 – 39 |
5 |
Homework:
- Find the mode of the following values: 22, 25, 22, 30, 25, 22, 25, 30, 25
- Using the grouped data below, calculate the mode:
|
Income ($) |
Frequency |
|
100–199 |
8 |
|
200–299 |
12 ← modal class |
|
300–399 |
9 |
|
400–499 |
6 |
Expanded Notes:
- Mode is unaffected by extreme values.
- Useful in market research to determine popular products.
- Often used in demographics to determine common household size.
Differentiation:
- Use color-coded frequency tables.
- Group learners for peer solving.
- Display graphs showing modal class visually.
Teacher’s Reflection:
- Did learners understand when and why to use mode?
- Were they able to correctly apply the grouped mode formula?
- Could they relate mode to real-world economic issues?