Download the Lessonotes Mobile Liberia app for faster lesson access on Android and iPhone.
Subject: Economics
Semester: 1
Period: 1
Week: 2
School Name:
Teacher’s Name:
Subject: Economics
Grade Level: Grade 11
Week & Period: Week 2, Period I
Date:
LEARNING OBJECTIVES
By the end of the lesson, learners should be able to:
- Define elasticity of demand and supply.
- Differentiate between price elasticity, income elasticity, and cross-price elasticity.
- Identify elastic and inelastic goods.
- Explain the real-world application of different elasticities.
INSTRUCTIONAL MATERIALS
- Graph sheets
- Diagrams of elastic and inelastic curves
- Demand and supply tables
- Charts comparing elasticities
- Flashcards (elastic/inelastic examples)
ANTICIPATION (Warm-Up)
Ask students:
“Why does the price of luxury shoes rise sharply but not affect the quantity sold much?”
“Why do people still buy salt even when its price rises?”
MAIN LESSON: BUILDING KNOWLEDGE
Definitions:
- Price Elasticity of Demand (PED): Measures how much quantity demanded changes in response to price changes.
- Elastic Demand: A small price change leads to a big change in quantity demanded (e.g. luxury goods).
- Inelastic Demand: A large price change leads to a small change in quantity demanded (e.g. salt, petrol).
- Price Elasticity of Supply (PES): Measures how quantity supplied responds to price changes.
- Income Elasticity of Demand (YED): Measures how quantity demanded changes as consumer income changes.
- Normal goods: Positive income elasticity.
- Inferior goods: Negative income elasticity.
- Cross-Price Elasticity of Demand (XED): Measures how the demand for one good changes when the price of another good changes.
- Substitute goods: Positive cross-price elasticity (e.g. Coke and Pepsi).
- Complementary goods: Negative cross-price elasticity (e.g. pen and ink).
GRAPHICAL REPRESENTATION
- Elastic Demand: Flat downward sloping demand curve
- Inelastic Demand: Steep downward sloping demand curve
- Use graphs to illustrate the various elasticity types.
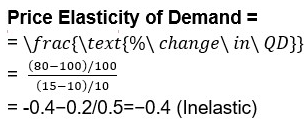
ILLUSTRATIVE EXAMPLES
|
Price (USD) |
Quantity Demanded |
|
10 |
100 |
|
15 |
80 |
ACTIVITY
Card Sorting Game:
- Students categorize products into elastic or inelastic groups with justification.
- Example: luxury car, bread, toothpaste, cinema tickets, medicine.
ASSESSMENT (Classwork)
- Define price elasticity of demand.
- List two examples each of elastic and inelastic goods.
- Differentiate between income elasticity and cross-price elasticity.
- Why might a medicine be inelastic in demand?
- Explain the concept of complementary goods with examples.
HOMEWORK
- Research and write a brief report on three goods with high price elasticity and three with low price elasticity in your local market.
EXPANDED NOTES
- Government uses knowledge of elasticity to determine taxes (inelastic goods can be taxed more).
- Businesses use it to set prices for maximizing revenue.
DIFFERENTIATION STRATEGIES
- Visual aids (graphs and charts) for learners who struggle with abstraction.
- Real-life product examples to relate to learner experience.
TEACHER’S REFLECTION
- Were learners able to interpret elasticity graphs?
- Did they grasp the difference between price elasticity and income/cross-price elasticity?