Download the Lessonotes Mobile Liberia app for faster lesson access on Android and iPhone.
Subject: Economics
Semester: 1
Period: 1
Week: 4
School Name:
Teacher’s Name:
Subject: Economics
Grade Level: Grade 11
Week & Period: Week 4, Period I
Date:
LEARNING OBJECTIVES
By the end of the lesson, learners should be able to:
- Explain the relationship between price elasticity of demand and total revenue.
- Analyze how demand elasticity affects business pricing strategy.
- Compute the price elasticity of supply and interpret results.
- Identify factors that influence the elasticity of supply.
INSTRUCTIONAL MATERIALS
- Charts showing demand curves
- Sample sales data for products
- Graph papers and rulers
- Calculators
- Worksheets for class activity
ANTICIPATION (Warm-Up)
Pose the question:
“If a store reduces the price of a good and ends up earning less revenue, what could have gone wrong?”
Allow students to brainstorm and lead into the topic of elasticity and revenue.
MAIN LESSON: BUILDING KNOWLEDGE
- Total Revenue and Elasticity of Demand
- Total Revenue (TR) = Price × Quantity Sold
- Elastic Demand: ↓ Price → ↑ Revenue
- Inelastic Demand: ↓ Price → ↓ Revenue
Summary Table:
|
Elasticity |
Price Change |
Effect on TR |
|
Elastic |
Decrease |
TR Increases |
|
Elastic |
Increase |
TR Decreases |
|
Inelastic |
Decrease |
TR Decreases |
|
Inelastic |
Increase |
TR Increases |
|
Unitary |
Any Change |
TR remains same |
- Calculation Example:
If price decreases from $20 to $18, and quantity increases from 100 to 130:
- Old TR = $20 × 100 = $2,000
- New TR = $18 × 130 = $2,340
- Revenue increases → Demand is elastic.
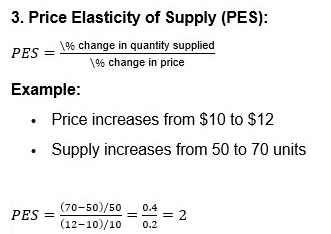
Interpretation: Supply is elastic.
- Determinants of Price Elasticity of Supply:
- Time (more elastic in long run)
- Availability of raw materials
- Spare production capacity
- Ability to store stock
- Mobility of factors of production
ACTIVITY (Class Work)
- Given price and quantity data, compute the total revenue and elasticity.
- In groups, students plot revenue curves and interpret elasticity zones.
ASSESSMENT (Formative Questions)
- Define Total Revenue.
- Explain what happens to TR when price falls and demand is elastic.
- Calculate TR for:
- P1 = $30, Q1 = 80;
- P2 = $25, Q2 = 100
- Compute PES when price rises from $15 to $18 and quantity increases from 60 to 75.
- List and explain any 3 determinants of PES.
HOMEWORK
A farmer increases the price of yam from $5 to $6. His sales drop from 500 to 450 tubers.
- Calculate PED.
- Calculate TR before and after the price change.
- Determine whether demand is elastic or inelastic and explain.
EXPANDED NOTES
- A business should avoid raising prices for elastic goods—it may lose revenue.
- PES is important for government policy on taxation and subsidies.
- Elasticity helps producers plan output according to market response.
DIFFERENTIATION STRATEGIES
- Step-by-step worked examples for weaker learners
- Graph plotting for visual learners
- Real-life products used in case studies for practical learners
TEACHER’S REFLECTION
- Did students understand TR and elasticity interaction?
- Were they able to perform calculations independently?
- Should the next lesson include revision or move forward?