Download the Lessonotes Mobile Liberia app for faster lesson access on Android and iPhone.
Subject: Mathematics
Semester: 1
Period: 1
Week: 1
WEEK 1
Class: Grade 12
Age: 16 years
Duration: 40 minutes for 5 periods
Subject: Mathematics
Topic: Cumulative Frequency III
Focus: Meaning of Deciles, Examples Showing Median and Quartiles from Graphs, Interquartile Range (Quarter Deviation) Using Formula
SPECIFIC OBJECTIVES:
By the end of the lesson, students should be able to:
- Understand the meaning of deciles and their applications.
- Identify and calculate median and quartiles from cumulative frequency graphs.
- Calculate the interquartile range (quarter deviation) using the formula.
INSTRUCTIONAL TECHNIQUES:
- Question and answer
- Guided demonstration
- Discussion
- Practice exercises
- Visual aids (graphs)
INSTRUCTIONAL MATERIALS:
- Graph board and graph book
- Charts illustrating cumulative frequency distributions
- Flashcards with example data sets
- Worksheets for practice problems
PERIOD 1: Introduction to Deciles
PRESENTATION:
|
Step |
Teacher’s Activity |
Student’s Activity |
|
Step 1 - Introduction |
Introduces the concept of deciles as the values that divide a data set into ten equal parts. Explains that deciles are related to percentiles but divide the data into 10 groups instead of 100. |
Students listen and take notes, asking questions if needed. |
|
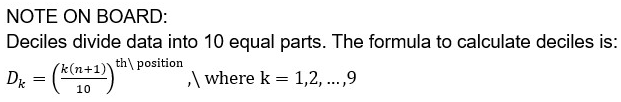
Step 2 - Formula for Deciles |
Explains how to calculate deciles using the formula for cumulative frequency and position of deciles. |
Students observe the formula and note it down. |
|
Step 3 - Real-Life Example |
Provides a real-life example of how deciles are used, such as analyzing income distribution. |
Students engage in a discussion about how deciles are applicable in real life. |
EVALUATION (5 exercises):
- What are deciles, and how are they different from percentiles?
- If a data set has 50 values, what is the position of the 1st decile?
- How can deciles be used in statistical analysis?
- Explain why we use deciles instead of percentiles in certain cases.
- Calculate the decile for the position 30th in a set of 100 values.
CLASSWORK (5 questions):
- Find the first decile for a data set of 80 values.
- How many groups are formed in a data set when dividing by deciles?
- Calculate the position for the 7th decile in a set of 120 values.
- Explain the purpose of deciles in data analysis.
- Write the formula for calculating the 9th decile.
ASSIGNMENT (5 tasks):
- Research real-life applications where deciles are used.
- Solve for the 3rd decile for a data set of 200 values.
- Write down the steps for calculating deciles.
- Calculate the first and fifth decile for a data set of 50 values.
- Compare the advantages of using deciles over quartiles.
PERIOD 2: Median and Quartiles from Graphs
PRESENTATION:
|
Step |
Teacher’s Activity |
Student’s Activity |
|
Step 1 - Explanation of Median |
Introduces the median as the middle value that divides the data into two equal parts when plotted. Shows how the median can be found from a cumulative frequency graph by locating the 50th percentile. |
Students listen and mark the median point on their graphs. |
|
Step 2 - Explanation of Quartiles |
Explains that quartiles divide data into four equal parts, with Q1 being the first quartile (25th percentile), Q2 as the median (50th percentile), and Q3 as the third quartile (75th percentile). |
Students mark quartiles on their graph using the given data. |
|
Step 3 - Graphing Median and Quartiles |
Demonstrates how to find the median and quartiles by reading values from a cumulative frequency graph. |
Students observe the graph and follow the teacher’s steps to find the quartiles. |
NOTE ON BOARD:
- Median: Located at the 50th percentile.
- Quartiles:
- Q1 = 25th percentile
- Q2 = Median (50th percentile)
- Q3 = 75th percentile
EVALUATION (5 exercises):
- How do you locate the median on a cumulative frequency graph?
- What is the value of the first quartile (Q1) for a data set of 100 values?
- How do you find Q3 from a cumulative frequency graph?
- What does the median represent in terms of data distribution?
- Identify the quartile values from the given cumulative frequency graph.
CLASSWORK (5 questions):
- Draw a cumulative frequency graph and identify the median.
- From the graph, calculate the first and third quartiles.
- What is the purpose of quartiles in summarizing data?
- How do you use the median and quartiles to describe the spread of data?
- Find the median from the given cumulative frequency graph of 120 values.
ASSIGNMENT (5 tasks):
- Calculate the median and quartiles for a data set of 200 values.
- Explain the relationship between the median and quartiles.
- Use the cumulative frequency graph to identify the median and quartiles for a data set of 50 values.
- Describe how to calculate quartiles from a cumulative frequency table.
- Solve for the median in a given set of 30 values using a cumulative frequency graph.
PERIOD 3 & 4: Interquartile Range and Quarter Deviation
PRESENTATION:
|
Step |
Teacher’s Activity |
Student’s Activity |
|
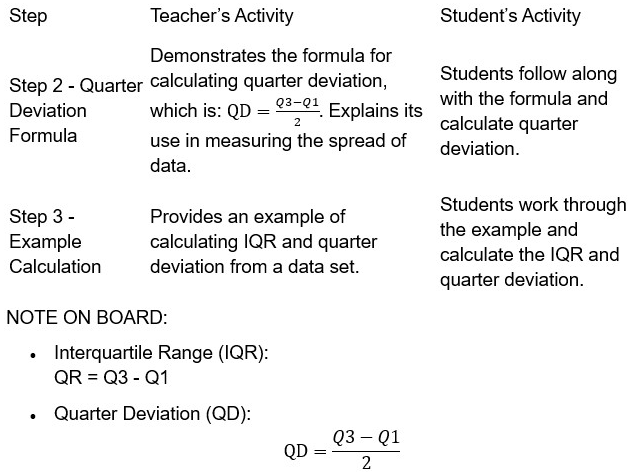
Step 1 - Introduction to Interquartile Range |
Explains the interquartile range (IQR) as the difference between the third and first quartile (Q3 - Q1), representing the spread of the middle 50% of data. |
Students take notes and prepare for calculations. |
EVALUATION (5 exercises):
- Calculate the interquartile range for a given data set.
- What is the quarter deviation for a set where Q1 = 10 and Q3 = 30?
- Find the IQR for a data set with Q1 = 15 and Q3 = 40.
- How do interquartile range and quarter deviation help in data analysis?
- Calculate the quarter deviation for a data set with quartiles Q1 = 12 and Q3 = 24.
CLASSWORK (5 questions):
- Calculate the interquartile range for a data set of 150 values.
- Find the quarter deviation for a data set with Q1 = 20 and Q3 = 50.
- How does the interquartile range help in understanding data spread?
- Calculate the IQR and quarter deviation for a data set with given quartiles.
- Solve for the quarter deviation for the data set with Q1 = 10 and Q3 = 35.
ASSIGNMENT (5 tasks):
- Calculate the interquartile range for a data set of 200 values.
- Find the quarter deviation for a data set with Q1 = 5 and Q3 = 15.
- Explain the significance of the interquartile range and quarter deviation.
- Solve for the quarter deviation for a data set of 100 values.
- Research real-life applications of the interquartile range and quarter deviation.
PERIOD 5: Practical Application and Practice
PRESENTATION:
|
Step |
Teacher’s Activity |
Student’s Activity |
|
Step 1 - Recap |
Recaps key concepts of deciles, quartiles, median, IQR, and quarter deviation. |
Students review the key concepts and ask questions. |
|
Step 2 - Practical Example |
Provides a practical example where students calculate all the concepts discussed (deciles, quartiles, IQR). |
Students work on the example in pairs, practicing the calculations. |
|
Step 3 - Practice Exercise |
Assigns an exercise for students to calculate all concepts from a given data set. |
Students complete the exercise individually. |
EVALUATION (5 exercises):
- Calculate the decile for a given data set.
- Find the quartiles and median for a data set.
- Calculate the interquartile range (IQR).
- Solve for the quarter deviation.
- Explain how deciles, quartiles, and IQR are used together in data analysis.
CLASSWORK (5 questions):
- From a given data set, calculate the median and quartiles.
- Find the IQR and quarter deviation for a data set.
- Solve for the decile position for a data set of 150 values.
- Identify the interquartile range from a graph.
- Calculate all quartiles for a given data set.
ASSIGNMENT (5 tasks):
- Research the importance of cumulative frequency graphs in data analysis.
- Complete exercises on deciles, quartiles, and IQR.
- Provide examples of how IQR is used in business statistics.
- Explain the relationship between deciles and quartiles.
- Solve for the quarter deviation in a given data set.