Download the Lessonotes Mobile Liberia app for faster lesson access on Android and iPhone.
Subject: Mathematics
Semester: 1
Period: 1
Week: 2
WEEK 2
Class: Grade 11
Age: 16 years
Duration: 40 minutes for 5 periods
Subject: Mathematics
Topic: Cumulative Frequency IV
Focus: Understanding Median, Percentiles, Quartiles, Deciles, and the Calculation of These Measures Using the Formula Method
SPECIFIC OBJECTIVES:
By the end of the lesson, students should be able to:
- Explain the meaning of the median on a cumulative frequency curve.
- Define and explain percentiles, quartiles, and deciles.
- Calculate the median, quartiles, deciles, and percentiles from grouped data using the formula method.
INSTRUCTIONAL TECHNIQUES:
- Lecture and Explanation
- Guided Practice
- Discussion and Q&A
- Demonstration and Graphing
- Hands-on Practice
INSTRUCTIONAL MATERIALS:
- Graph board and graph books
- Ruler and pencil
- Published charts of cumulative frequency curves
- Data from previous lessons (capital market, stock market, etc.)
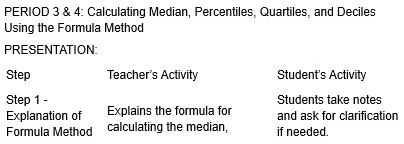
PERIOD 1 & 2: Introduction to Median, Percentiles, Quartiles, and Deciles
PRESENTATION:
|
Step |
Teacher’s Activity |
Student’s Activity |
|
Step 1 - Introduction |
Defines the median from a cumulative frequency curve and explains its importance. Introduces the concepts of percentiles, quartiles, and deciles. |
Students listen attentively and take notes. |
|
Step 2 - Explanation of Percentiles, Quartiles, and Deciles |
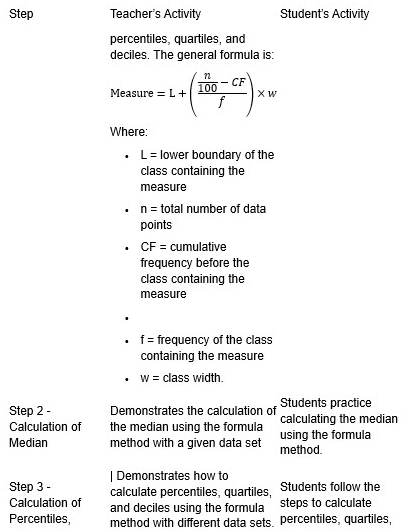
Explains each concept in detail:
|
Students ask questions and engage in discussion |
|
Step 3 - Drawing Cumulative Frequency Curve (Ogive) |
Guides students to plot cumulative frequency curves using given data and explains how these curves help in finding the median, quartiles, percentiles, and deciles |
Students follow the steps and draw cumulative frequency curves on graph paper. |
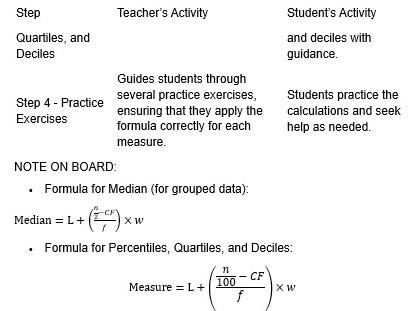
NOTE ON BOARD:
- Median: The value that separates the data into two equal halves.
- Percentiles: Divides the data into 100 equal parts.
- Quartiles: Divides the data into 4 equal parts (Q1, Q2, Q3).
- Deciles: Divides the data into 10 equal parts.
- Cumulative Frequency Curve: Use the curve to visually estimate the median, quartiles, and deciles.
EVALUATION (5 Exercises):
- What is the median in a cumulative frequency curve?
- Define percentiles.
- What is the difference between quartiles and deciles?
- Explain how to find the median from a cumulative frequency curve.
- What is the importance of drawing an ogive in statistics?
CLASSWORK (5 Questions):
- What does a cumulative frequency curve represent?
- How can you estimate the median from an ogive?
- Explain how you would use an ogive to find quartiles.
- Draw a cumulative frequency curve for the following data set: [2, 4, 6, 8, 10, 12, 14, 16, 18, 20].
- How do you interpret the position of the 50th percentile in a cumulative frequency curve?
ASSIGNMENT (5 Tasks):
- Draw a cumulative frequency curve for a given set of data from the stock market.
- Calculate the 90th percentile from the following data set: [5, 10, 15, 20, 25, 30, 35, 40].
- What is the first quartile (Q1) of the following data set: [3, 5, 8, 10, 12, 15, 18, 20]?
- Calculate the deciles for the data set: [1, 4, 7, 10, 13, 16, 19, 22, 25].
- Why is it important to understand percentiles in data analysis?
EVALUATION (5 Exercises):
- Calculate the median for the following data set: [1, 2, 3, 4, 5, 6, 7, 8, 9].
- Calculate the 25th percentile for the following data set: [10, 20, 30, 40, 50].
- Determine the first quartile (Q1) for the data set: [12, 14, 16, 18, 20, 22, 24, 26, 28].
- Find the 90th percentile from the following data set: [5, 10, 15, 20, 25, 30].
- Calculate the decile for the 7th position in the data set: [3, 6, 9, 12, 15, 18, 21, 24].
CLASSWORK (5 Questions):
- Find the median for the following data set: [3, 5, 7, 9, 11].
- Calculate the 75th percentile for the data set: [1, 2, 3, 4, 5, 6, 7, 8, 9].
- Calculate the 10th decile for the data set: [1, 2, 3, 4, 5].
- What is the difference between percentiles and quartiles?
- How do you calculate the quartiles using the formula method?
ASSIGNMENT (5 Tasks):
- Calculate the median for the data set: [10, 20, 30, 40, 50, 60, 70, 80, 90].
- Find the first quartile (Q1) for the data set: [5, 10, 15, 20, 25, 30, 35, 40, 45, 50].
- Determine the 50th percentile for the data set: [1, 3, 5, 7, 9, 11, 13, 15, 17].
- Calculate the decile for the 4th position from the data set: [8, 16, 24, 32, 40, 48, 56, 64].
- Why is the median a more reliable measure of central tendency than the mean in some situations?